
 Index Options
 CME Group
 Nasdaq
 Cboe
Cboe TradingView
 Wall Street Journal
KPIT Technologies Limited's (NSE:KPITTECH) largest shareholders are private companies who were rewarded as market cap surged ₹11b last week
Key Insights
- KPIT Technologies' significant private companies ownership suggests that the key decisions are influenced by shareholders from the larger public
- A total of 8 investors have a majority stake in the company with 51% ownership
- Insiders have sold recently
To get a sense of who is truly in control of KPIT Technologies Limited (NSE:KPITTECH), it is important to understand the ownership structure of the business. The group holding the most number of shares in the company, around 33% to be precise, is private companies. Put another way, the group faces the maximum upside potential (or downside risk).
As a result, private companies collectively scored the highest last week as the company hit ₹319b market cap following a 3.7% gain in the stock.
Let's delve deeper into each type of owner of KPIT Technologies, beginning with the chart below.
View our latest analysis for KPIT Technologies
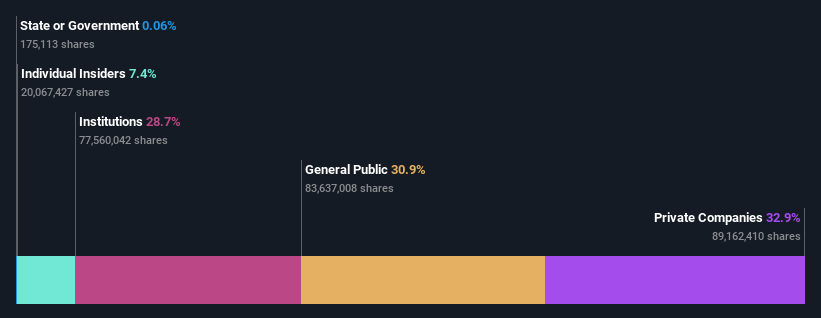
What Does The Institutional Ownership Tell Us About KPIT Technologies?
Institutions typically measure themselves against a benchmark when reporting to their own investors, so they often become more enthusiastic about a stock once it's included in a major index. We would expect most companies to have some institutions on the register, especially if they are growing.
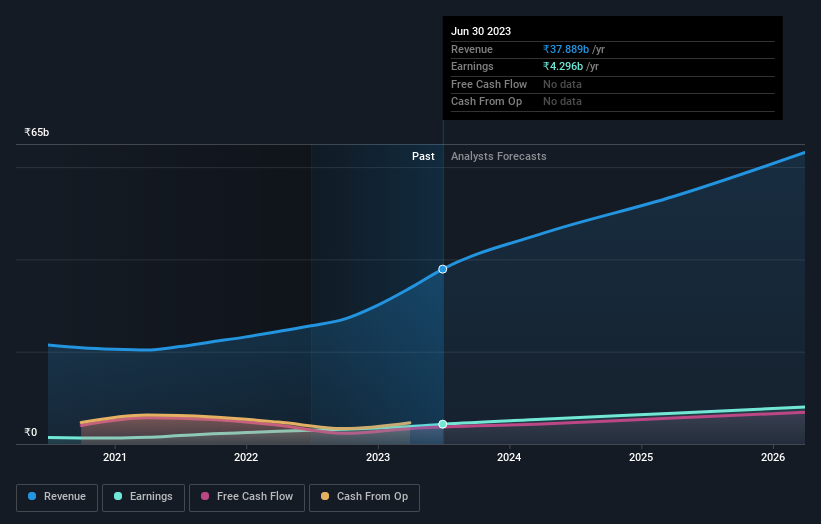
We can see that KPIT Technologies does have institutional investors; and they hold a good portion of the company's stock. This implies the analysts working for those institutions have looked at the stock and they like it. But just like anyone else, they could be wrong. It is not uncommon to see a big share price drop if two large institutional investors try to sell out of a stock at the same time. So it is worth checking the past earnings trajectory of KPIT Technologies, (below). Of course, keep in mind that there are other factors to consider, too.
Hedge funds don't have many shares in KPIT Technologies. Proficient Finstock LLP is currently the largest shareholder, with 33% of shares outstanding. Meanwhile, the second and third largest shareholders, hold 4.9% and 3.1%, of the shares outstanding, respectively. Kishor Patil, who is the second-largest shareholder, also happens to hold the title of Chief Executive Officer.
We also observed that the top 8 shareholders account for more than half of the share register, with a few smaller shareholders to balance the interests of the larger ones to a certain extent.
While it makes sense to study institutional ownership data for a company, it also makes sense to study analyst sentiments to know which way the wind is blowing. Quite a few analysts cover the stock, so you could look into forecast growth quite easily.
Insider Ownership Of KPIT Technologies
While the precise definition of an insider can be subjective, almost everyone considers board members to be insiders. The company management answer to the board and the latter should represent the interests of shareholders. Notably, sometimes top-level managers are on the board themselves.
Most consider insider ownership a positive because it can indicate the board is well aligned with other shareholders. However, on some occasions too much power is concentrated within this group.
We can see that insiders own shares in KPIT Technologies Limited. This is a big company, so it is good to see this level of alignment. Insiders own ₹24b worth of shares (at current prices). It is good to see this level of investment by insiders. You can check here to see if those insiders have been buying recently.
General Public Ownership
The general public, who are usually individual investors, hold a 31% stake in KPIT Technologies. While this group can't necessarily call the shots, it can certainly have a real influence on how the company is run.
Private Company Ownership
It seems that Private Companies own 33%, of the KPIT Technologies stock. It's hard to draw any conclusions from this fact alone, so its worth looking into who owns those private companies. Sometimes insiders or other related parties have an interest in shares in a public company through a separate private company.
Next Steps:
I find it very interesting to look at who exactly owns a company. But to truly gain insight, we need to consider other information, too. Consider for instance, the ever-present spectre of investment risk. We've identified 2 warning signs with KPIT Technologies , and understanding them should be part of your investment process.
Ultimately the future is most important. You can access this free report on analyst forecasts for the company.
NB: Figures in this article are calculated using data from the last twelve months, which refer to the 12-month period ending on the last date of the month the financial statement is dated. This may not be consistent with full year annual report figures.
Have feedback on this article? Concerned about the content? Get in touch with us directly. Alternatively, email editorial-team (at) simplywallst.com.
This article by Simply Wall St is general in nature. We provide commentary based on historical data and analyst forecasts only using an unbiased methodology and our articles are not intended to be financial advice. It does not constitute a recommendation to buy or sell any stock, and does not take account of your objectives, or your financial situation. We aim to bring you long-term focused analysis driven by fundamental data. Note that our analysis may not factor in the latest price-sensitive company announcements or qualitative material. Simply Wall St has no position in any stocks mentioned.
- PEVM
- 0.1499
- -25.05%