
- PREMIUM
- LIVE QUOTES
- INSTITUTIONS
 Index Options
 State Street
 CME Group
 Nasdaq
 Cboe
Cboe TradingView
 Wall Street Journal
Institutional owners may ignore Reckitt Benckiser Group plc's (LON:RKT) recent UK£2.2b market cap decline as longer-term profits stay in the green
Key Insights
- Significantly high institutional ownership implies Reckitt Benckiser Group's stock price is sensitive to their trading actions
- A total of 24 investors have a majority stake in the company with 50% ownership
- Analyst forecasts along with ownership data serve to give a strong idea about prospects for a business
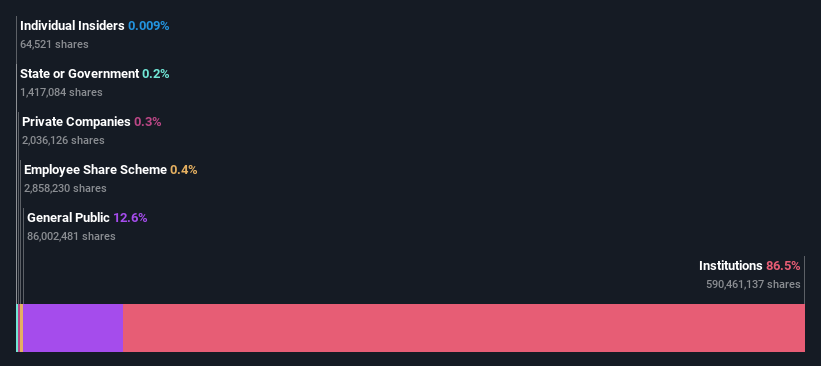
Every investor in Reckitt Benckiser Group plc (LON:RKT) should be aware of the most powerful shareholder groups. The group holding the most number of shares in the company, around 86% to be precise, is institutions. In other words, the group stands to gain the most (or lose the most) from their investment into the company.
Institutional investors was the group most impacted after the company's market cap fell to UK£33b last week. However, the 19% one-year return to shareholders might have softened the blow. They should, however, be mindful of further losses in the future.
Let's delve deeper into each type of owner of Reckitt Benckiser Group, beginning with the chart below.
Check out our latest analysis for Reckitt Benckiser Group
What Does The Institutional Ownership Tell Us About Reckitt Benckiser Group?
Many institutions measure their performance against an index that approximates the local market. So they usually pay more attention to companies that are included in major indices.
Reckitt Benckiser Group already has institutions on the share registry. Indeed, they own a respectable stake in the company. This suggests some credibility amongst professional investors. But we can't rely on that fact alone since institutions make bad investments sometimes, just like everyone does. If multiple institutions change their view on a stock at the same time, you could see the share price drop fast. It's therefore worth looking at Reckitt Benckiser Group's earnings history below. Of course, the future is what really matters.

Since institutional investors own more than half the issued stock, the board will likely have to pay attention to their preferences. We note that hedge funds don't have a meaningful investment in Reckitt Benckiser Group. Looking at our data, we can see that the largest shareholder is BlackRock, Inc. with 8.2% of shares outstanding. The Vanguard Group, Inc. is the second largest shareholder owning 5.1% of common stock, and Flossbach & Von Storch Vermoegensmanagement AG holds about 3.2% of the company stock.
After doing some more digging, we found that the top 24 have the combined ownership of 50% in the company, suggesting that no single shareholder has significant control over the company.
While it makes sense to study institutional ownership data for a company, it also makes sense to study analyst sentiments to know which way the wind is blowing. Quite a few analysts cover the stock, so you could look into forecast growth quite easily.
Insider Ownership Of Reckitt Benckiser Group
The definition of company insiders can be subjective and does vary between jurisdictions. Our data reflects individual insiders, capturing board members at the very least. Company management run the business, but the CEO will answer to the board, even if he or she is a member of it.
Insider ownership is positive when it signals leadership are thinking like the true owners of the company. However, high insider ownership can also give immense power to a small group within the company. This can be negative in some circumstances.
Our data suggests that insiders own under 1% of Reckitt Benckiser Group plc in their own names. It is a very large company, so it would be surprising to see insiders own a large proportion of the company. Though their holding amounts to less than 1%, we can see that board members collectively own UK£3.1m worth of shares (at current prices). In this sort of situation, it can be more interesting to see if those insiders have been buying or selling.
General Public Ownership
The general public-- including retail investors -- own 13% stake in the company, and hence can't easily be ignored. While this group can't necessarily call the shots, it can certainly have a real influence on how the company is run.
Next Steps:
I find it very interesting to look at who exactly owns a company. But to truly gain insight, we need to consider other information, too. Consider risks, for instance. Every company has them, and we've spotted 3 warning signs for Reckitt Benckiser Group you should know about.
But ultimately it is the future, not the past, that will determine how well the owners of this business will do. Therefore we think it advisable to take a look at this free report showing whether analysts are predicting a brighter future .
NB: Figures in this article are calculated using data from the last twelve months, which refer to the 12-month period ending on the last date of the month the financial statement is dated. This may not be consistent with full year annual report figures.
Have feedback on this article? Concerned about the content? Get in touch with us directly. Alternatively, email editorial-team (at) simplywallst.com.
This article by Simply Wall St is general in nature. We provide commentary based on historical data and analyst forecasts only using an unbiased methodology and our articles are not intended to be financial advice. It does not constitute a recommendation to buy or sell any stock, and does not take account of your objectives, or your financial situation. We aim to bring you long-term focused analysis driven by fundamental data. Note that our analysis may not factor in the latest price-sensitive company announcements or qualitative material. Simply Wall St has no position in any stocks mentioned.