
 Index Options
 CME Group
 Nasdaq
 Cboe
Cboe TradingView
 Wall Street Journal
Tosoh Corporation (TSE:4042) is favoured by institutional owners who hold 52% of the company
Key Insights
- Significantly high institutional ownership implies Tosoh's stock price is sensitive to their trading actions
- The top 23 shareholders own 50% of the company
- Using data from analyst forecasts alongside ownership research, one can better assess the future performance of a company
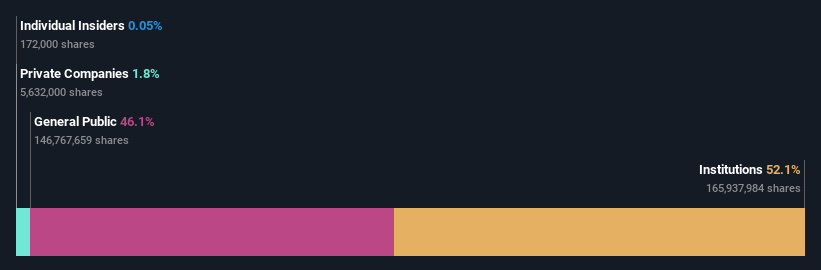
A look at the shareholders of Tosoh Corporation (TSE:4042) can tell us which group is most powerful. The group holding the most number of shares in the company, around 52% to be precise, is institutions. That is, the group stands to benefit the most if the stock rises (or lose the most if there is a downturn).
Since institutional have access to huge amounts of capital, their market moves tend to receive a lot of scrutiny by retail or individual investors. Hence, having a considerable amount of institutional money invested in a company is often regarded as a desirable trait.
In the chart below, we zoom in on the different ownership groups of Tosoh.
Check out our latest analysis for Tosoh
What Does The Institutional Ownership Tell Us About Tosoh?
Institutions typically measure themselves against a benchmark when reporting to their own investors, so they often become more enthusiastic about a stock once it's included in a major index. We would expect most companies to have some institutions on the register, especially if they are growing.
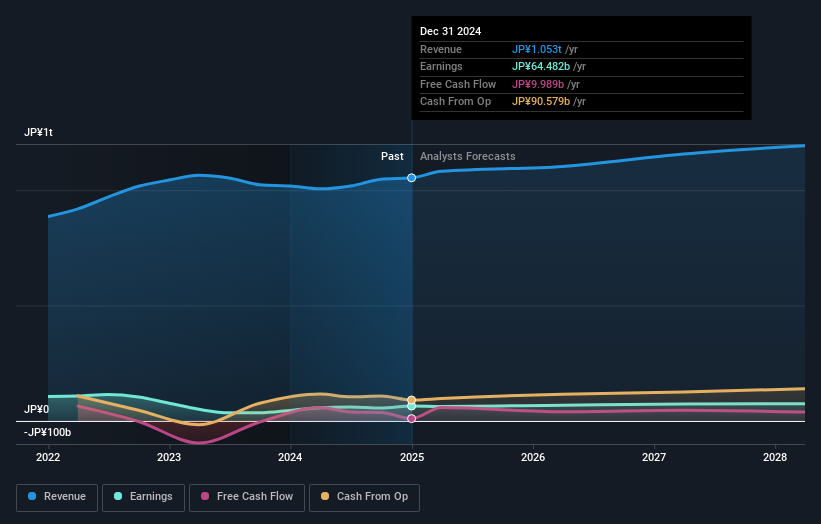
We can see that Tosoh does have institutional investors; and they hold a good portion of the company's stock. This can indicate that the company has a certain degree of credibility in the investment community. However, it is best to be wary of relying on the supposed validation that comes with institutional investors. They too, get it wrong sometimes. When multiple institutions own a stock, there's always a risk that they are in a 'crowded trade'. When such a trade goes wrong, multiple parties may compete to sell stock fast. This risk is higher in a company without a history of growth. You can see Tosoh's historic earnings and revenue below, but keep in mind there's always more to the story.
Since institutional investors own more than half the issued stock, the board will likely have to pay attention to their preferences. We note that hedge funds don't have a meaningful investment in Tosoh. The company's largest shareholder is Nomura Asset Management Co., Ltd., with ownership of 5.1%. In comparison, the second and third largest shareholders hold about 4.6% and 4.5% of the stock.
A closer look at our ownership figures suggests that the top 23 shareholders have a combined ownership of 50% implying that no single shareholder has a majority.
Researching institutional ownership is a good way to gauge and filter a stock's expected performance. The same can be achieved by studying analyst sentiments. There are a reasonable number of analysts covering the stock, so it might be useful to find out their aggregate view on the future.
Insider Ownership Of Tosoh
While the precise definition of an insider can be subjective, almost everyone considers board members to be insiders. The company management answer to the board and the latter should represent the interests of shareholders. Notably, sometimes top-level managers are on the board themselves.
I generally consider insider ownership to be a good thing. However, on some occasions it makes it more difficult for other shareholders to hold the board accountable for decisions.
Our information suggests that Tosoh Corporation insiders own under 1% of the company. However, it's possible that insiders might have an indirect interest through a more complex structure. Keep in mind that it's a big company, and the insiders own JP¥336m worth of shares. The absolute value might be more important than the proportional share. It is always good to see at least some insider ownership, but it might be worth checking if those insiders have been selling.
General Public Ownership
With a 46% ownership, the general public, mostly comprising of individual investors, have some degree of sway over Tosoh. This size of ownership, while considerable, may not be enough to change company policy if the decision is not in sync with other large shareholders.
Next Steps:
While it is well worth considering the different groups that own a company, there are other factors that are even more important. For instance, we've identified 1 warning sign for Tosoh that you should be aware of.
If you are like me, you may want to think about whether this company will grow or shrink. Luckily, you can check this free report showing analyst forecasts for its future .
NB: Figures in this article are calculated using data from the last twelve months, which refer to the 12-month period ending on the last date of the month the financial statement is dated. This may not be consistent with full year annual report figures.
Have feedback on this article? Concerned about the content? Get in touch with us directly. Alternatively, email editorial-team (at) simplywallst.com.
This article by Simply Wall St is general in nature. We provide commentary based on historical data and analyst forecasts only using an unbiased methodology and our articles are not intended to be financial advice. It does not constitute a recommendation to buy or sell any stock, and does not take account of your objectives, or your financial situation. We aim to bring you long-term focused analysis driven by fundamental data. Note that our analysis may not factor in the latest price-sensitive company announcements or qualitative material. Simply Wall St has no position in any stocks mentioned.