
 Index Options
 CME Group
 Nasdaq
 Cboe
Cboe TradingView
 Wall Street Journal
Stella-Jones Inc.'s (TSE:SJ) Stock Has Been Sliding But Fundamentals Look Strong: Is The Market Wrong?
Stella-Jones (TSE:SJ) has had a rough three months with its share price down 4.5%. However, stock prices are usually driven by a company’s financial performance over the long term, which in this case looks quite promising. In this article, we decided to focus on Stella-Jones' ROE.
Return on equity or ROE is an important factor to be considered by a shareholder because it tells them how effectively their capital is being reinvested. In other words, it is a profitability ratio which measures the rate of return on the capital provided by the company's shareholders.
How Is ROE Calculated?
Return on equity can be calculated by using the formula:
Return on Equity = Net Profit (from continuing operations) ÷ Shareholders' Equity
So, based on the above formula, the ROE for Stella-Jones is:
16% = CA$319m ÷ CA$1.9b (Based on the trailing twelve months to December 2024).
The 'return' is the profit over the last twelve months. Another way to think of that is that for every CA$1 worth of equity, the company was able to earn CA$0.16 in profit.
View our latest analysis for Stella-Jones
What Has ROE Got To Do With Earnings Growth?
Thus far, we have learned that ROE measures how efficiently a company is generating its profits. Based on how much of its profits the company chooses to reinvest or "retain", we are then able to evaluate a company's future ability to generate profits. Generally speaking, other things being equal, firms with a high return on equity and profit retention, have a higher growth rate than firms that don’t share these attributes.
Stella-Jones' Earnings Growth And 16% ROE
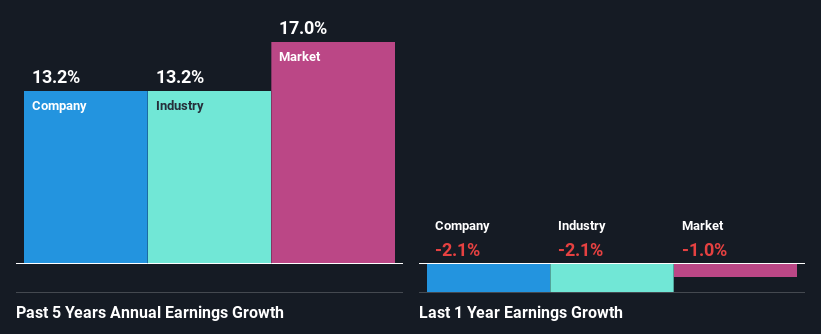
At first glance, Stella-Jones seems to have a decent ROE. Further, the company's ROE is similar to the industry average of 16%. This certainly adds some context to Stella-Jones' moderate 13% net income growth seen over the past five years.
As a next step, we compared Stella-Jones' net income growth with the industry and found that the company has a similar growth figure when compared with the industry average growth rate of 13% in the same period.
The basis for attaching value to a company is, to a great extent, tied to its earnings growth. What investors need to determine next is if the expected earnings growth, or the lack of it, is already built into the share price. Doing so will help them establish if the stock's future looks promising or ominous. If you're wondering about Stella-Jones''s valuation, check out this gauge of its price-to-earnings ratio , as compared to its industry.
Is Stella-Jones Using Its Retained Earnings Effectively?
Stella-Jones' three-year median payout ratio to shareholders is 20% (implying that it retains 80% of its income), which is on the lower side, so it seems like the management is reinvesting profits heavily to grow its business.
Additionally, Stella-Jones has paid dividends over a period of at least ten years which means that the company is pretty serious about sharing its profits with shareholders. Our latest analyst data shows that the future payout ratio of the company over the next three years is expected to be approximately 23%. Therefore, the company's future ROE is also not expected to change by much with analysts predicting an ROE of 14%.
Summary
Overall, we are quite pleased with Stella-Jones' performance. Specifically, we like that the company is reinvesting a huge chunk of its profits at a high rate of return. This of course has caused the company to see substantial growth in its earnings. With that said, the latest industry analyst forecasts reveal that the company's earnings growth is expected to slow down. To know more about the latest analysts predictions for the company, check out this visualization of analyst forecasts for the company.
Have feedback on this article? Concerned about the content? Get in touch with us directly. Alternatively, email editorial-team (at) simplywallst.com.
This article by Simply Wall St is general in nature. We provide commentary based on historical data and analyst forecasts only using an unbiased methodology and our articles are not intended to be financial advice. It does not constitute a recommendation to buy or sell any stock, and does not take account of your objectives, or your financial situation. We aim to bring you long-term focused analysis driven by fundamental data. Note that our analysis may not factor in the latest price-sensitive company announcements or qualitative material. Simply Wall St has no position in any stocks mentioned.