
 Index Options
 CME Group
 Nasdaq
 Cboe
Cboe TradingView
 Wall Street Journal
ASML Holding N.V.'s (AMS:ASML) latest 10% decline adds to one-year losses, institutional investors may consider drastic measures
Key Insights
- Institutions' substantial holdings in ASML Holding implies that they have significant influence over the company's share price
- The top 25 shareholders own 32% of the company
- Recent sales by insiders
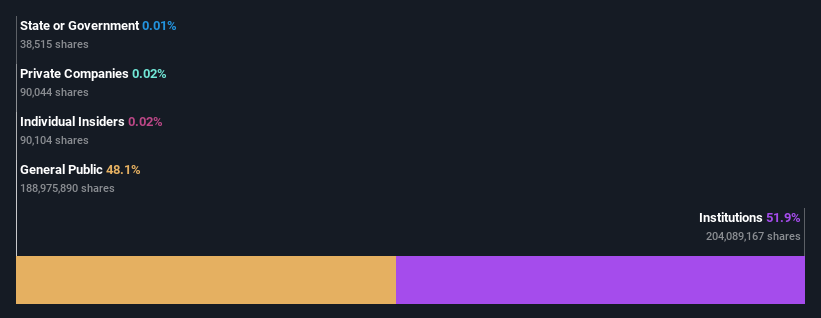
To get a sense of who is truly in control of ASML Holding N.V. (AMS:ASML), it is important to understand the ownership structure of the business. We can see that institutions own the lion's share in the company with 52% ownership. Put another way, the group faces the maximum upside potential (or downside risk).
And institutional investors endured the highest losses after the company's share price fell by 10% last week. This set of investors may especially be concerned about the current loss, which adds to a one-year loss of 39% for shareholders. Often called “market movers", institutions wield significant power in influencing the price dynamics of any stock. Hence, if weakness in ASML Holding's share price continues, institutional investors may feel compelled to sell the stock, which might not be ideal for individual investors.
Let's delve deeper into each type of owner of ASML Holding, beginning with the chart below.
See our latest analysis for ASML Holding
What Does The Institutional Ownership Tell Us About ASML Holding?
Many institutions measure their performance against an index that approximates the local market. So they usually pay more attention to companies that are included in major indices.
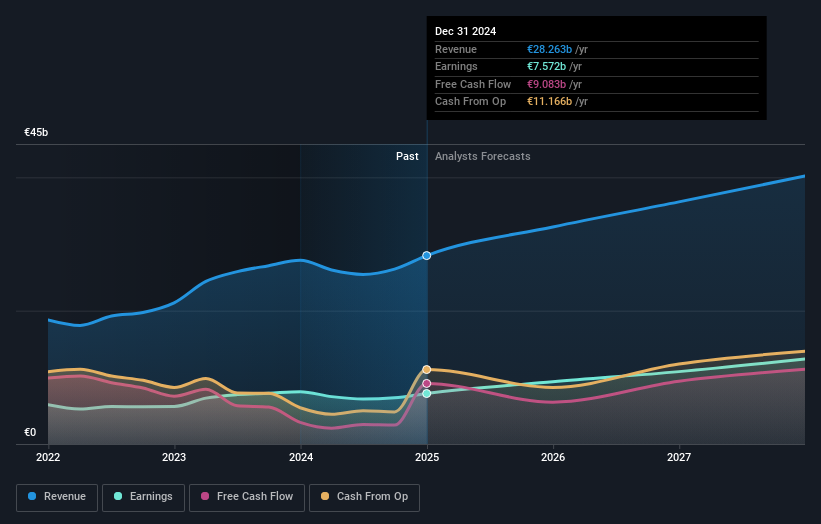
As you can see, institutional investors have a fair amount of stake in ASML Holding. This can indicate that the company has a certain degree of credibility in the investment community. However, it is best to be wary of relying on the supposed validation that comes with institutional investors. They too, get it wrong sometimes. It is not uncommon to see a big share price drop if two large institutional investors try to sell out of a stock at the same time. So it is worth checking the past earnings trajectory of ASML Holding, (below). Of course, keep in mind that there are other factors to consider, too.
Since institutional investors own more than half the issued stock, the board will likely have to pay attention to their preferences. We note that hedge funds don't have a meaningful investment in ASML Holding. BlackRock, Inc. is currently the company's largest shareholder with 8.4% of shares outstanding. In comparison, the second and third largest shareholders hold about 4.0% and 2.6% of the stock.
A deeper look at our ownership data shows that the top 25 shareholders collectively hold less than half of the register, suggesting a large group of small holders where no single shareholder has a majority.
Researching institutional ownership is a good way to gauge and filter a stock's expected performance. The same can be achieved by studying analyst sentiments. Quite a few analysts cover the stock, so you could look into forecast growth quite easily.
Insider Ownership Of ASML Holding
The definition of an insider can differ slightly between different countries, but members of the board of directors always count. The company management answer to the board and the latter should represent the interests of shareholders. Notably, sometimes top-level managers are on the board themselves.
I generally consider insider ownership to be a good thing. However, on some occasions it makes it more difficult for other shareholders to hold the board accountable for decisions.
Our data suggests that insiders own under 1% of ASML Holding N.V. in their own names. As it is a large company, we'd only expect insiders to own a small percentage of it. But it's worth noting that they own €50m worth of shares. It is always good to see at least some insider ownership, but it might be worth checking if those insiders have been selling.
General Public Ownership
The general public, who are usually individual investors, hold a 48% stake in ASML Holding. While this size of ownership may not be enough to sway a policy decision in their favour, they can still make a collective impact on company policies.
Next Steps:
While it is well worth considering the different groups that own a company, there are other factors that are even more important. Consider risks, for instance. Every company has them, and we've spotted 1 warning sign for ASML Holding you should know about.
If you are like me, you may want to think about whether this company will grow or shrink. Luckily, you can check this free report showing analyst forecasts for its future .
NB: Figures in this article are calculated using data from the last twelve months, which refer to the 12-month period ending on the last date of the month the financial statement is dated. This may not be consistent with full year annual report figures.
Have feedback on this article? Concerned about the content? Get in touch with us directly. Alternatively, email editorial-team (at) simplywallst.com.
This article by Simply Wall St is general in nature. We provide commentary based on historical data and analyst forecasts only using an unbiased methodology and our articles are not intended to be financial advice. It does not constitute a recommendation to buy or sell any stock, and does not take account of your objectives, or your financial situation. We aim to bring you long-term focused analysis driven by fundamental data. Note that our analysis may not factor in the latest price-sensitive company announcements or qualitative material. Simply Wall St has no position in any stocks mentioned.