
 Index Options
 CME Group
 Nasdaq
 Cboe
Cboe TradingView
 Wall Street Journal
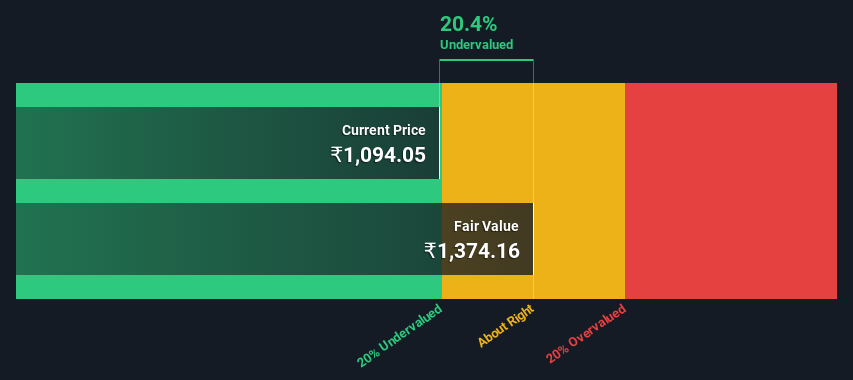
Is Dr. Reddy's Laboratories Limited (NSE:DRREDDY) Trading At A 20% Discount?
Key Insights
- Dr. Reddy's Laboratories' estimated fair value is ₹1,374 based on 2 Stage Free Cash Flow to Equity
- Current share price of ₹1,094 suggests Dr. Reddy's Laboratories is potentially 20% undervalued
- The ₹1,325 analyst price target for DRREDDY is 3.6% less than our estimate of fair value
Does the April share price for Dr. Reddy's Laboratories Limited (NSE:DRREDDY) reflect what it's really worth? Today, we will estimate the stock's intrinsic value by estimating the company's future cash flows and discounting them to their present value. One way to achieve this is by employing the Discounted Cash Flow (DCF) model. There's really not all that much to it, even though it might appear quite complex.
We generally believe that a company's value is the present value of all of the cash it will generate in the future. However, a DCF is just one valuation metric among many, and it is not without flaws. For those who are keen learners of equity analysis, the Simply Wall St analysis model here may be something of interest to you.
The Calculation
We use what is known as a 2-stage model, which simply means we have two different periods of growth rates for the company's cash flows. Generally the first stage is higher growth, and the second stage is a lower growth phase. To begin with, we have to get estimates of the next ten years of cash flows. Where possible we use analyst estimates, but when these aren't available we extrapolate the previous free cash flow (FCF) from the last estimate or reported value. We assume companies with shrinking free cash flow will slow their rate of shrinkage, and that companies with growing free cash flow will see their growth rate slow, over this period. We do this to reflect that growth tends to slow more in the early years than it does in later years.
A DCF is all about the idea that a dollar in the future is less valuable than a dollar today, and so the sum of these future cash flows is then discounted to today's value:
10-year free cash flow (FCF) estimate
| 2025 | 2026 | 2027 | 2028 | 2029 | 2030 | 2031 | 2032 | 2033 | 2034 | |
| Levered FCF (₹, Millions) | ₹11.2b | ₹48.2b | ₹50.3b | ₹70.6b | ₹81.9b | ₹92.7b | ₹103.1b | ₹113.3b | ₹123.5b | ₹133.7b |
| Growth Rate Estimate Source | Analyst x21 | Analyst x21 | Analyst x19 | Analyst x1 | Est @ 15.96% | Est @ 13.19% | Est @ 11.25% | Est @ 9.89% | Est @ 8.94% | Est @ 8.27% |
| Present Value (₹, Millions) Discounted @ 13% | ₹10.0k | ₹38.0k | ₹35.3k | ₹44.1k | ₹45.4k | ₹45.7k | ₹45.1k | ₹44.1k | ₹42.7k | ₹41.1k |
("Est" = FCF growth rate estimated by Simply Wall St)
Present Value of 10-year Cash Flow (PVCF) = ₹391b
We now need to calculate the Terminal Value, which accounts for all the future cash flows after this ten year period. The Gordon Growth formula is used to calculate Terminal Value at a future annual growth rate equal to the 5-year average of the 10-year government bond yield of 6.7%. We discount the terminal cash flows to today's value at a cost of equity of 13%.
Terminal Value (TV)= FCF2034 × (1 + g) ÷ (r – g) = ₹134b× (1 + 6.7%) ÷ (13%– 6.7%) = ₹2.5t
Present Value of Terminal Value (PVTV)= TV / (1 + r)10= ₹2.5t÷ ( 1 + 13%)10= ₹755b
The total value, or equity value, is then the sum of the present value of the future cash flows, which in this case is ₹1.1t. To get the intrinsic value per share, we divide this by the total number of shares outstanding. Compared to the current share price of ₹1.1k, the company appears a touch undervalued at a 20% discount to where the stock price trades currently. The assumptions in any calculation have a big impact on the valuation, so it is better to view this as a rough estimate, not precise down to the last cent.
The Assumptions
Now the most important inputs to a discounted cash flow are the discount rate, and of course, the actual cash flows. You don't have to agree with these inputs, I recommend redoing the calculations yourself and playing with them. The DCF also does not consider the possible cyclicality of an industry, or a company's future capital requirements, so it does not give a full picture of a company's potential performance. Given that we are looking at Dr. Reddy's Laboratories as potential shareholders, the cost of equity is used as the discount rate, rather than the cost of capital (or weighted average cost of capital, WACC) which accounts for debt. In this calculation we've used 13%, which is based on a levered beta of 0.800. Beta is a measure of a stock's volatility, compared to the market as a whole. We get our beta from the industry average beta of globally comparable companies, with an imposed limit between 0.8 and 2.0, which is a reasonable range for a stable business.
See our latest analysis for Dr. Reddy's Laboratories
SWOT Analysis for Dr. Reddy's Laboratories
- Debt is not viewed as a risk.
- Earnings growth over the past year underperformed the Pharmaceuticals industry.
- Dividend is low compared to the top 25% of dividend payers in the Pharmaceuticals market.
- Good value based on P/E ratio and estimated fair value.
- Dividends are not covered by cash flow.
- Annual earnings are forecast to decline for the next 4 years.
Next Steps:
Whilst important, the DCF calculation is only one of many factors that you need to assess for a company. It's not possible to obtain a foolproof valuation with a DCF model. Preferably you'd apply different cases and assumptions and see how they would impact the company's valuation. For instance, if the terminal value growth rate is adjusted slightly, it can dramatically alter the overall result. Can we work out why the company is trading at a discount to intrinsic value? For Dr. Reddy's Laboratories, we've put together three essential elements you should further examine:
- Risks: We feel that you should assess the 2 warning signs for Dr. Reddy's Laboratories (1 is concerning!) we've flagged before making an investment in the company.
- Future Earnings: How does DRREDDY's growth rate compare to its peers and the wider market? Dig deeper into the analyst consensus number for the upcoming years by interacting with our free analyst growth expectation chart .
- Other Solid Businesses: Low debt, high returns on equity and good past performance are fundamental to a strong business. Why not explore our interactive list of stocks with solid business fundamentals to see if there are other companies you may not have considered!
PS. The Simply Wall St app conducts a discounted cash flow valuation for every stock on the NSEI every day. If you want to find the calculation for other stocks just search here.
Have feedback on this article? Concerned about the content? Get in touch with us directly. Alternatively, email editorial-team (at) simplywallst.com.
This article by Simply Wall St is general in nature. We provide commentary based on historical data and analyst forecasts only using an unbiased methodology and our articles are not intended to be financial advice. It does not constitute a recommendation to buy or sell any stock, and does not take account of your objectives, or your financial situation. We aim to bring you long-term focused analysis driven by fundamental data. Note that our analysis may not factor in the latest price-sensitive company announcements or qualitative material. Simply Wall St has no position in any stocks mentioned.