
 Index Options
 CME Group
 Nasdaq
 Cboe
Cboe TradingView
 Wall Street Journal
Institutional owners may take dramatic actions as Mitsui & Co., Ltd.'s (TSE:8031) recent 12% drop adds to one-year losses
Key Insights
- Given the large stake in the stock by institutions, Mitsui's stock price might be vulnerable to their trading decisions
- The top 19 shareholders own 50% of the company
- Analyst forecasts along with ownership data serve to give a strong idea about prospects for a business
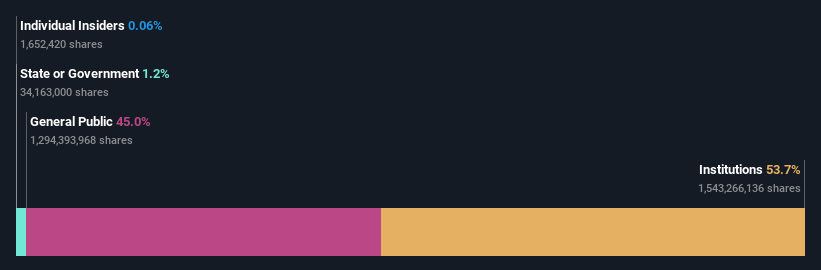
To get a sense of who is truly in control of Mitsui & Co., Ltd. (TSE:8031), it is important to understand the ownership structure of the business. We can see that institutions own the lion's share in the company with 54% ownership. That is, the group stands to benefit the most if the stock rises (or lose the most if there is a downturn).
And institutional investors saw their holdings value drop by 12% last week. This set of investors may especially be concerned about the current loss, which adds to a one-year loss of 30% for shareholders. Also referred to as "smart money", institutions have a lot of sway over how a stock's price moves. As a result, if the downtrend continues, institutions may face pressures to sell Mitsui, which might have negative implications on individual investors.
In the chart below, we zoom in on the different ownership groups of Mitsui.
See our latest analysis for Mitsui
What Does The Institutional Ownership Tell Us About Mitsui?
Institutions typically measure themselves against a benchmark when reporting to their own investors, so they often become more enthusiastic about a stock once it's included in a major index. We would expect most companies to have some institutions on the register, especially if they are growing.
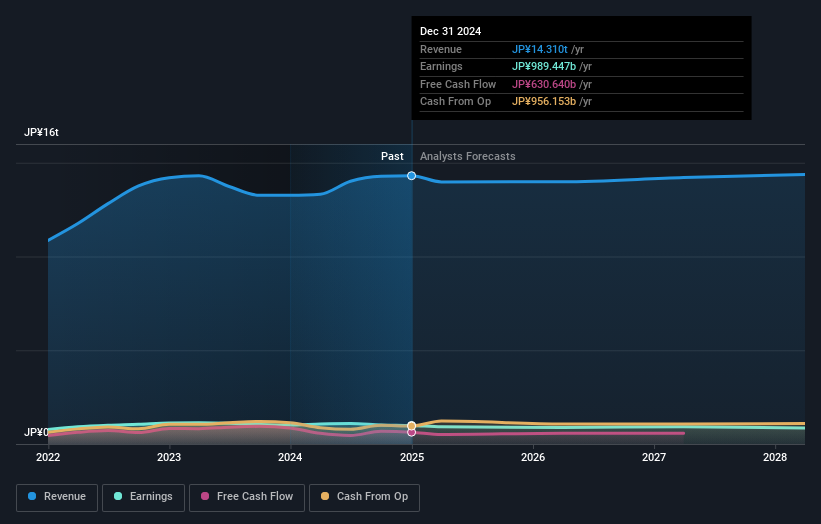
Mitsui already has institutions on the share registry. Indeed, they own a respectable stake in the company. This suggests some credibility amongst professional investors. But we can't rely on that fact alone since institutions make bad investments sometimes, just like everyone does. If multiple institutions change their view on a stock at the same time, you could see the share price drop fast. It's therefore worth looking at Mitsui's earnings history below. Of course, the future is what really matters.
Institutional investors own over 50% of the company, so together than can probably strongly influence board decisions. Mitsui is not owned by hedge funds. New England Asset Management, Inc. is currently the company's largest shareholder with 9.9% of shares outstanding. With 7.3% and 5.6% of the shares outstanding respectively, BlackRock, Inc. and Nomura Asset Management Co., Ltd. are the second and third largest shareholders.
After doing some more digging, we found that the top 19 have the combined ownership of 50% in the company, suggesting that no single shareholder has significant control over the company.
While studying institutional ownership for a company can add value to your research, it is also a good practice to research analyst recommendations to get a deeper understand of a stock's expected performance. Quite a few analysts cover the stock, so you could look into forecast growth quite easily.
Insider Ownership Of Mitsui
The definition of company insiders can be subjective and does vary between jurisdictions. Our data reflects individual insiders, capturing board members at the very least. The company management answer to the board and the latter should represent the interests of shareholders. Notably, sometimes top-level managers are on the board themselves.
Insider ownership is positive when it signals leadership are thinking like the true owners of the company. However, high insider ownership can also give immense power to a small group within the company. This can be negative in some circumstances.
Our data suggests that insiders own under 1% of Mitsui & Co., Ltd. in their own names. Being so large, we would not expect insiders to own a large proportion of the stock. Collectively, they own JP¥4.1b of stock. It is good to see board members owning shares, but it might be worth checking if those insiders have been buying.
General Public Ownership
The general public-- including retail investors -- own 45% stake in the company, and hence can't easily be ignored. While this size of ownership may not be enough to sway a policy decision in their favour, they can still make a collective impact on company policies.
Next Steps:
It's always worth thinking about the different groups who own shares in a company. But to understand Mitsui better, we need to consider many other factors. For instance, we've identified 3 warning signs for Mitsui (2 shouldn't be ignored) that you should be aware of.
If you would prefer discover what analysts are predicting in terms of future growth, do not miss this free report on analyst forecasts .
NB: Figures in this article are calculated using data from the last twelve months, which refer to the 12-month period ending on the last date of the month the financial statement is dated. This may not be consistent with full year annual report figures.
Have feedback on this article? Concerned about the content? Get in touch with us directly. Alternatively, email editorial-team (at) simplywallst.com.
This article by Simply Wall St is general in nature. We provide commentary based on historical data and analyst forecasts only using an unbiased methodology and our articles are not intended to be financial advice. It does not constitute a recommendation to buy or sell any stock, and does not take account of your objectives, or your financial situation. We aim to bring you long-term focused analysis driven by fundamental data. Note that our analysis may not factor in the latest price-sensitive company announcements or qualitative material. Simply Wall St has no position in any stocks mentioned.