
 Index Options
 CME Group
 Nasdaq
 Cboe
Cboe TradingView
 Wall Street Journal
Procter & Gamble Hygiene and Health Care's (NSE:PGHH) investors will be pleased with their notable 64% return over the last five years
If you buy and hold a stock for many years, you'd hope to be making a profit. Furthermore, you'd generally like to see the share price rise faster than the market. Unfortunately for shareholders, while the Procter & Gamble Hygiene and Health Care Limited (NSE:PGHH) share price is up 53% in the last five years, that's less than the market return. However, more recent buyers should be happy with the increase of 22% over the last year.
So let's assess the underlying fundamentals over the last 5 years and see if they've moved in lock-step with shareholder returns.
Check out our latest analysis for Procter & Gamble Hygiene and Health Care
In his essay The Superinvestors of Graham-and-Doddsville Warren Buffett described how share prices do not always rationally reflect the value of a business. One way to examine how market sentiment has changed over time is to look at the interaction between a company's share price and its earnings per share (EPS).
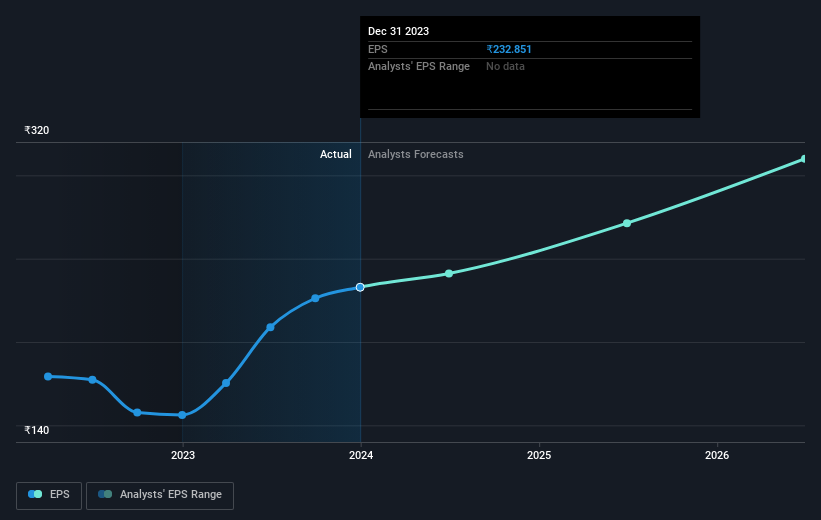
During five years of share price growth, Procter & Gamble Hygiene and Health Care achieved compound earnings per share (EPS) growth of 14% per year. This EPS growth is higher than the 9% average annual increase in the share price. So it seems the market isn't so enthusiastic about the stock these days. Of course, with a P/E ratio of 71.74, the market remains optimistic.
The company's earnings per share (over time) is depicted in the image below (click to see the exact numbers).
We're pleased to report that the CEO is remunerated more modestly than most CEOs at similarly capitalized companies. But while CEO remuneration is always worth checking, the really important question is whether the company can grow earnings going forward. This free interactive report on Procter & Gamble Hygiene and Health Care's earnings, revenue and cash flow is a great place to start, if you want to investigate the stock further.
What About Dividends?
It is important to consider the total shareholder return, as well as the share price return, for any given stock. The TSR is a return calculation that accounts for the value of cash dividends (assuming that any dividend received was reinvested) and the calculated value of any discounted capital raisings and spin-offs. It's fair to say that the TSR gives a more complete picture for stocks that pay a dividend. In the case of Procter & Gamble Hygiene and Health Care, it has a TSR of 64% for the last 5 years. That exceeds its share price return that we previously mentioned. And there's no prize for guessing that the dividend payments largely explain the divergence!
A Different Perspective
Procter & Gamble Hygiene and Health Care provided a TSR of 24% over the last twelve months. But that return falls short of the market. On the bright side, that's still a gain, and it's actually better than the average return of 10% over half a decade It is possible that returns will improve along with the business fundamentals. I find it very interesting to look at share price over the long term as a proxy for business performance. But to truly gain insight, we need to consider other information, too. Even so, be aware that Procter & Gamble Hygiene and Health Care is showing 1 warning sign in our investment analysis , you should know about...
But note: Procter & Gamble Hygiene and Health Care may not be the best stock to buy. So take a peek at this free list of interesting companies with past earnings growth (and further growth forecast).
Please note, the market returns quoted in this article reflect the market weighted average returns of stocks that currently trade on Indian exchanges.
Have feedback on this article? Concerned about the content? Get in touch with us directly. Alternatively, email editorial-team (at) simplywallst.com.
This article by Simply Wall St is general in nature. We provide commentary based on historical data and analyst forecasts only using an unbiased methodology and our articles are not intended to be financial advice. It does not constitute a recommendation to buy or sell any stock, and does not take account of your objectives, or your financial situation. We aim to bring you long-term focused analysis driven by fundamental data. Note that our analysis may not factor in the latest price-sensitive company announcements or qualitative material. Simply Wall St has no position in any stocks mentioned.