How to Apply Fibonacci Retracement in Trading

What are Fibonacci Retracement Levels?
Fibonacci retracement levels are lines that run horizontally along a chart and can imply potential support and resistance levels where a price reversal is possible. Common Fibonacci retracement levels are found at 23.6%, 38.2%, 61.8%, and 78.6%, which are all calculated based on the Fibonacci sequence.
In the Fibonacci sequence, any given number in the series is the two numbers before it added together. 0, 1, 1, 2, 3, 5, 8, 13, and so on.
Although not calculated based on the sequence, 50% is also regarded as an important Fibonacci retracement level.
How does Fibonacci retracement help with trading?
The Fibonacci retracements are accepted and used by many investors, which gives them a self-fulfilling aspect—if a significant number of people are buying and selling on Fibonacci retracement levels, then the price may follow those patterns.
Fibonacci retracement can be a useful tool in confirming a trading signal or identifying a stop loss/take profit level. It can be applied to any timeframe, depending on the investment horizon of the investor.
Using Fibonacci retracement for risk management
In an uptrend, you can use the Fibonacci retracement tool to connect the low point and the high point to view the key levels. In a downtrend, connect the high point to the low point instead, as shown below.

Investors can identify Fibonacci retracement levels to stop losses and take profits.
In the example below, the stock bounces back after a significant fall that lasted for 3 months. Pulling the Fibonacci retracement out by connecting the high and low points of the swing, we can see all the levels at which the stock might be prevented from pushing higher. These levels could also be support lines that hold the price from falling further.
Suppose an investor enters a long position after a new low is hit. They might place a stop order at $134, the previous low, to cover their position. Meanwhile, they might place a limit order at $154, the 50% Fibonacci retracement level, to lock in profit.
Subsequently, the price goes all the way up to break through the 23.6% and 38.2% level, bounces back at 38.2%, breaks through 50% but falls quickly below it, forming a resistance level.
Their take profit order would be triggered at the 50% Fibonacci retracement level, closing the long position before the price drops further.

Using Fibonacci retracement to confirm trading signals
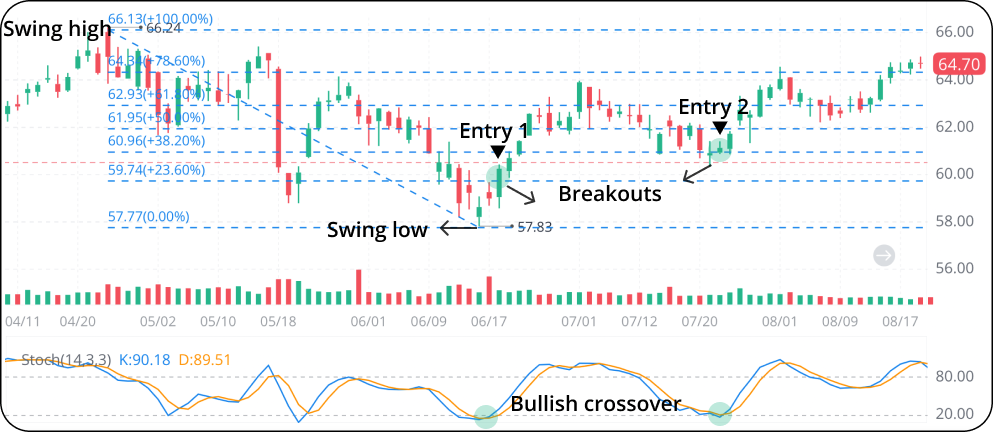
Investors can identify Fibonacci retracement levels as important support and resistance levels to confirm trading signals. For example, they may wait until the price breaks through a Fibonacci retracement level to enter a long position to trade a bullish MACD/stochastic oscillator crossover.
In the example below, an investor may open a long position at Entry 1 when the price hits the 23.6% Fibonacci retracement level, following a bullish crossover in the stochastic oscillator. The second entry point develops when a second bullish crossover is formed, with the price landing above the 38.2% Fibonacci retracement level.

The bottom line
Fibonacci retracement levels are important support and resistance levels followed by many investors. They can be used to identify entry and exit points if combined with the results of technical indicators.
 Index Options
 State Street
 CME Group
 Nasdaq
 Cboe
Cboe TradingView
 Wall Street Journal